.png?width=64&height=64&name=header%20product%20icons%20%20(9).png)
.png?width=64&height=64&name=header%20product%20icons%20%20(1).png)
.png?width=64&height=68&name=header%20product%20icons%20%20(2).png)
.png?width=64&height=64&name=header%20product%20icons%20%20(5).png)
.png?width=64&height=64&name=header%20product%20icons%20%20(4).png)
.png?width=64&height=64&name=header%20product%20icons%20%20(3).png)
.png?width=64&height=64&name=header%20product%20icons%20%20(11).png)
.png?width=64&height=64&name=header%20product%20icons%20%20(10).png)
.png?width=64&height=64&name=header%20product%20icons%20%20(6).png)
.png?width=64&height=64&name=header%20product%20icons%20%20(12).png)
.png?width=64&height=65&name=header%20product%20icons%20%20(28).png)
.png?width=64&height=64&name=header%20product%20icons%20%20(30).png)
.png?width=64&height=64&name=header%20product%20icons%20%20(13).png)
.png?width=64&height=64&name=header%20product%20icons%20%20(15).png)
.png?width=64&height=64&name=header%20product%20icons%20%20(14).png)
.png?width=156&height=156&name=header%20product%20icons%20%20(44).png)
.png?width=64&height=64&name=header%20product%20icons%20%20(16).png)
.png?width=64&height=64&name=header%20product%20icons%20%20(19).png)
.png?width=64&height=64&name=header%20product%20icons%20%20(17).png)
.png?width=64&height=64&name=header%20product%20icons%20%20(18).png)
.png?width=64&height=64&name=header%20product%20icons%20%20(20).png)
.png?width=64&height=64&name=header%20product%20icons%20%20(21).png)
.png?width=64&height=64&name=header%20product%20icons%20%20(24).png)
.png?width=64&height=64&name=header%20product%20icons%20%20(26).png)
.png?width=64&height=64&name=header%20product%20icons%20%20(23).png)
.png?width=64&height=64&name=header%20product%20icons%20%20(22).png)
.png?width=64&height=64&name=header%20product%20icons%20%20(25).png)
.png?width=64&height=64&name=header%20product%20icons%20%20(27).png)
 By
·
9 minute read
By
·
9 minute read
Marketing Mix Modeling is the analysis of aggregate data which allows you to determine the effectiveness of your marketing activities. Using this approach means making decisions based on data, rather than just historical actions and intuition. It is part of a wider trend encompassing digital analytics and data science. Marketing Mix Modeling allows us to quantify the impact of the marketing mix on Key Performance Indicators (KPIs). Typical KPIs include customer actions like sales and churn, and financial measures like revenue and profits, while at the same time, reducing the cost of gaining each new customer. This covers both the short and long term. Marketing Mix Modeling is considered the gold standard technique for measuring marketing effectiveness.
As a marketer, you want to be able to determine how hard your marketing budget is working and how you can get the most bang for your buck. But how do you go about achieving this?
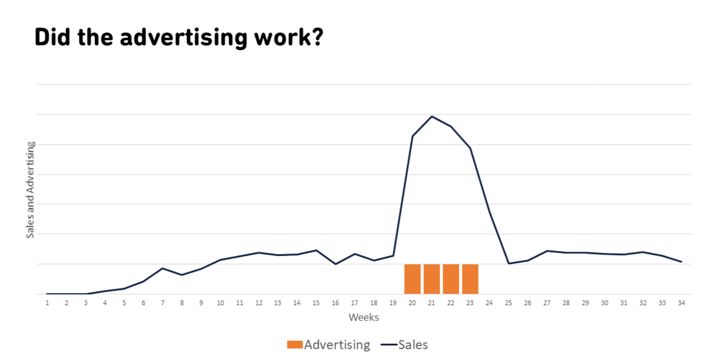
Let’s take the example from the graph above. The blue line represents the sales from a product that launched fairly recently. You'll see in the middle of the graph in weeks 20 to 23, there was a small burst of advertising. At first glance, it appears that the advertising has worked well, massively increasing sales. If it hasn't cost too much and your ROI is positive, then this is certainly something that you would look to roll out in the future.
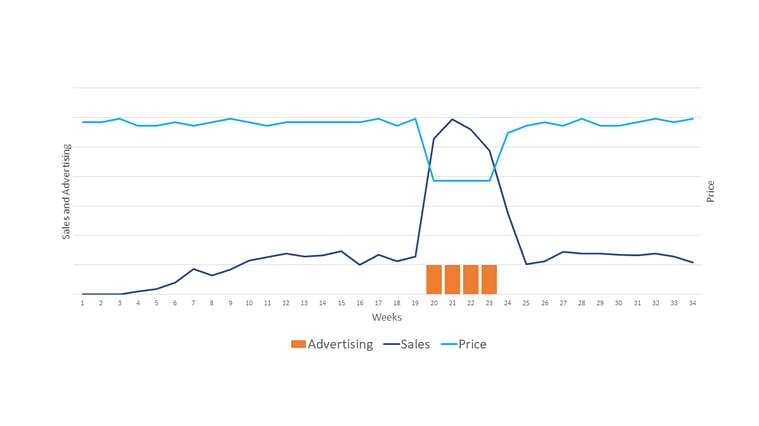
However, as you collect more data, you can see that at the same time as the advertising, you also ran a price promotion. Now, it is unclear if this increase in your sales was because of the advertising, the promotion, or, most likely a combination of the two. When you just chart the data, there are only a few categories, market places, and products, where you can actually see the impact of activities such as advertising. Far too often it is just a small noise amongst all the other activities, so you generally need to use more sophisticated techniques than simply creating a chart or two in Excel.
There are more ways than one to measure marketing effectiveness
When beginning to measure your marketing effectiveness you’ll want to make sure you have a balance of both broad and detailed information. For example, you can look at things like click-through rate (CTR) or last click if you are dealing with an online product or online activity. But, if you're attributing all your sales to whichever marketing activity somebody clicked on last, you're disregarding all your previous online advertisements that they have seen. That can lead to you making the wrong conclusions and therefore the wrong recommendations as to what to do in your media and marketing plan.
There is also Multi-touch attribution (MTA), which is quite popular at the moment. This approach uses cookie-level data, meaning it’s focused on the online world. Where you have online KPIs and online activity, it can get you very detailed results quickly, helping you feed information into campaign planning.
However, Multi-touch attribution is not great at capturing the impacts of your offline activities. This is where Marketing Mixed Modeling (MMM) comes into its own. MMM has been around for many years and it can be used to measure the impact of both online and offline activities on both your online and offline KPIs. It takes longer to run than Multi-touch attribution, but it enables you to compare the effectiveness of your activities on a like-for-like basis, which can be very important when you're making multimillion-dollar decisions.
The history of Marketing Mix Modeling
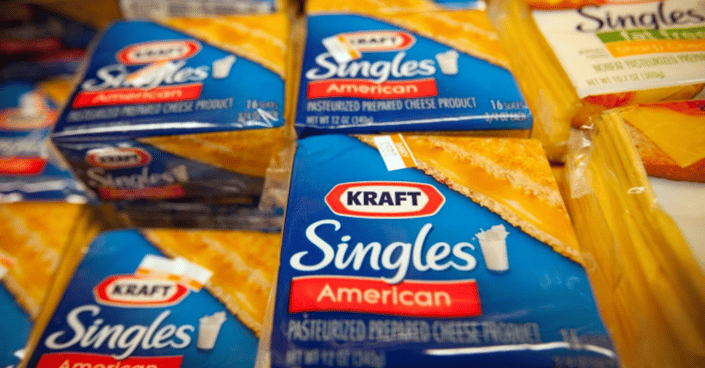
Marketing Mix Modeling has been around for more than 60 years. In the 1960s, Kraft Foods was one of the first companies to use this type of marketing analysis to improve their business performance and better understand the impact of their sales movements. Consumer-Packaged Goods (CPG) were one of the first industries that had access to consumer sales, pricing, advertising, and market share data from Nielsen tracking. Day-to-day results weren’t as good back then and often you were using monthly or even bi-monthly data. Today, things have fortunately moved forward, and you can now get data at a far more detailed level. Kraft was aware that marketing was a big business driver and as they started analyzing its impact on sales, so did many other firms. Econometricians and statisticians were hired to use data to help advertisers measure the impact of their decisions on sales and market share and thus, Marketing Mix Modeling was born. Today, Marketing Mix Modeling is still a very widely used tool in most sectors, including retail, pharmaceutical, gaming, telecoms, finance, and utilities.
What is Marketing Mix Modeling?
But when we talk about modeling, what do we mean? A model acts as a simplified representation of reality. A very famous example of a model is the London underground map as pictured below. The map is a brilliant way to navigate around London if you're using the tube. This is not the case if you want to try and use it to navigate above ground, as the distances on the map have been dramatically changed to make it more visually appealing and useful.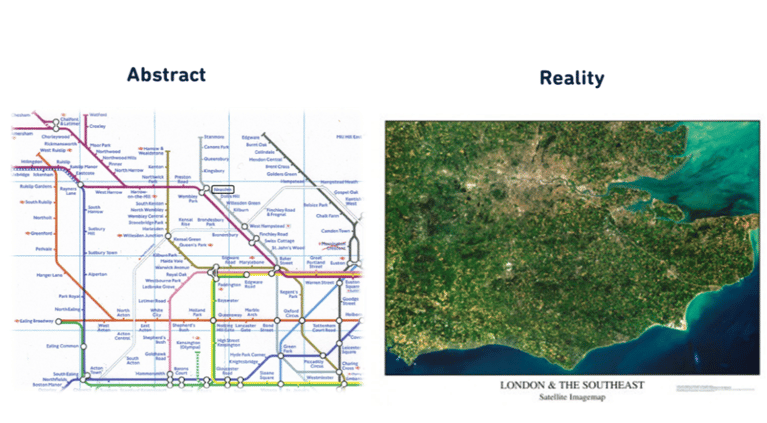
With Marketing Mix Modeling, you're also creating a simplified version of reality. You use data about the various activities you have run, based on what you think might be influencing your sales. From there you are building an equation that will help to bring those relationships together. Now, when we say equation, it's actually simultaneous equations for those of you who remember them from school. Though it's not what we will focus on in this piece. Most commonly, the factors used in this type of analysis are ones that you as a brand have control over, such as your advertising, promotions, or any digital activities. Some factors are outside of your control, such as the weather, the economy, and dare we say, COVID-19. You should also keep your competitors in mind as they are likely to have an impact on your sales and your brand. Occasionally, it can be a positive impact as it helps to increase awareness of a category, but far too often, it's negative. In the end, you are bringing together data on all these different factors to try and understand which are influencing the week-by-week movements in your sales. This allows you to get a better idea of how well things are working so that you can inform your future plans and increase your profitability and return on investment.
Now, there is no one perfect solution. Nothing should be used in isolation. You should have many other insights and reports within your business. Use those as you would any other technique to help build a fuller and rounder picture of your business to see what's going on. And when you're making those plans, bear in mind, some of the things that you perhaps don't necessarily have data on, such as changing your creative, etc.
Using historic data to quantify the impact of marketing activities
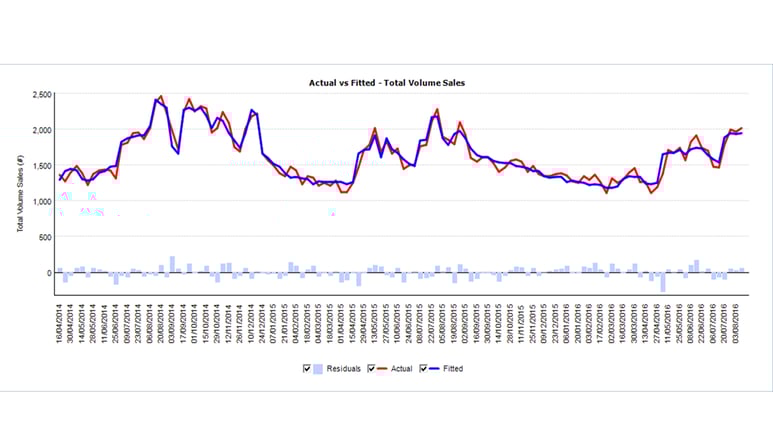
As we mentioned before, Marketing Mix Modeling means making decisions based on historic data, rather than just historical actions and intuition. If you look at the example above, you’ll see that the red line is a chart of actual sales. These are the sales that a brand achieved on a week-by-week basis for about three years. With modeling, you are taking the list of factors that you believe might influence those sales and trying to work out what combination of them, with different weights and levels of importance, will give you a simplified representation of those sales. So, what will give you that blue line or model? It takes a bit of tinkering and a few iterations, but eventually, you can get there and get a good understanding of the sale movements.
Keep in mind that your modeling must be statistically valid, and there are many statistics that will help you with the quality of your model. It must also make business sense. This part is really important. Your model is no good if it just makes mathematical sense. Too often things can be correlated but not causing an impact on one another.
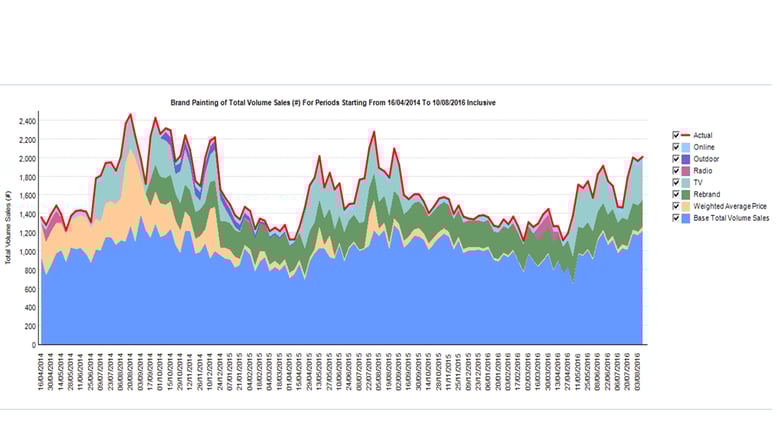
Having a chart such as the one above might give you a bit of faith in the quality of a model, but it's not so great when you're reporting to your Seniors. A visual representation, such as the one in the example below, is generally far better. A picture paints a thousand words as they say. But what is this chart showing you? You might hear it called a decomposition chart or a brand painting, and essentially you take the red line, so actual sales, and break it down to show how many additional sales you gained through changes in different factors. For example, if you look at the chart below, the color beige represents where you’ve gained sales through price promotions and reductions in price. You'll see that the impact of this diminishes over time as the price increased. You can also see the impact of your TV, radio, online, and outdoor activities. The brand painting is a great visual representation to show when and from which activities you gain sales. Keep in mind, this isn’t taking into account how much more you spent on each individual activity. For example, did you spend more on TV? Is that why you have a bigger uplift?
Where to start with Marketing Mix Modeling
Marketing Mix Modeling has been around for many years, but why is it so important now? Particularly in the times of COVID-19, everyone is being held accountable for the decisions that they're making and for the budgets that they've been given to spend. You need to ensure that money is being spent wisely.
And as we mentioned, Marketing Mix Modeling is a proven methodology. Using this approach helps you maintain accountability for your marketing plans and budgets. But where do you start if you're going to run an analysis such as this? You should start by asking key stakeholders a few important questions:
- Why are we conducting this analysis?
- What are the questions that need answering?
- What decisions do we need to make? And when do we need to have the results and the recommendations so that we can inform those decisions?
- What is our top priority?
We might have many questions that need answering, but which one is going to have the biggest impact on the business, which one is going to help us the most financially? Below are a few examples of the kind of questions and objectives that you could set in this analysis.
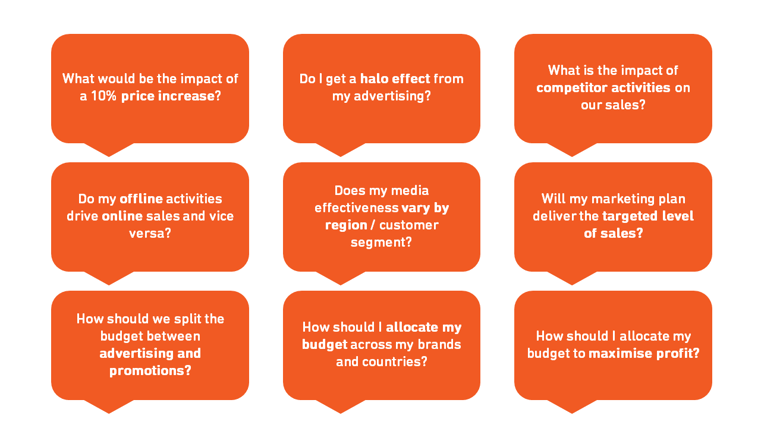
With Marketing Mix Modeling, you can answer questions like the impact of a price change, or how much your competitor’s activities are stealing from your sales, what impact your media is having in each geographical region, or perhaps by customer segment.
Plan with Marketing Mix Modeling
Marketing Mix Modeling is a backward-looking analysis, but the results can also be used to look to the future. You can use the insights gained from the models to help decide how best to allocate your budget between different activities, but also between different brands and different countries. And if your budgets were cut, the insights can be used to help you minimize the impact that it might have on sales.
How does this all fit together? You start by setting your objectives, and from there, you can determine what data you need to be able to answer those questions and what level of detail you need to go into. Then begins the sometimes lengthy process of actually collecting your data and ensuring that it's all correct. You then really need to get to know that data and become the expert on it, to make sure that you fully understand what you’re looking at and therefore what it might tell you when you put it into a model.
Once you have your data ready, how do you go about creating a model? It is an iterative process so you will probably go round and round in circles to ensure that you've got a model that makes both statistical and business sense. Now, once you have a model that you're happy with, you can then pull together the results into a summary that answers the questions that your stakeholders posed. You can then use those insights with your planning and optimizing.
Once you have your objectives set, you’ll need to work out which data you’ll need to get the insights you are looking for. First, you’ll want to establish which KPI’s you’ll be observing, which KPIs do we need to model to understand what causes the movements in them. For example, the KPIs could be sales, volume sales, revenue, or website visits. Or perhaps if you're an online business, it could be your online sales. The number of KPIs that you can model is enormous.
Once we know what KPIs you’re going to look at, you can decide how detailed you want to go. If you were to conduct your analysis at a national level, would that be detailed enough to provide the insights that you need? Maybe you need to dig further down and look at information by region, by customer segment, or by store level by retailer.
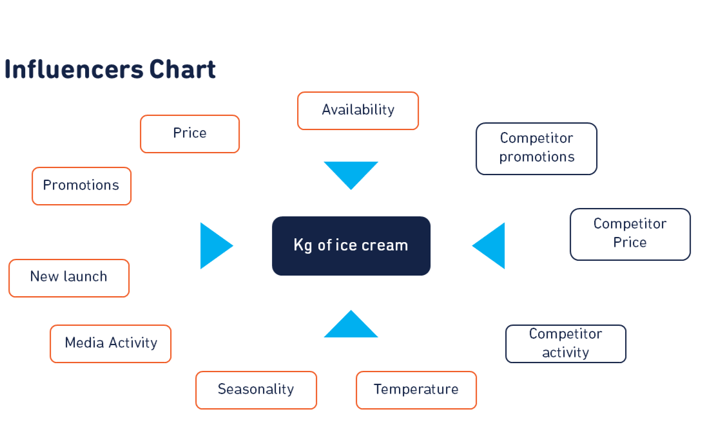
Finally, what factors do you think influence your brand? This could be something like advertising, promotions, availability, so things that you can control, but also those things that you can't. What is your competition doing? What advertising and promotions are they running? Have they launched any new products or campaigns? Have there been any changes in legislation as to what you're allowed to say or to sell? You must also take into consideration things like seasonality, but this doesn’t just mean the temperature or weather conditions. It could also include things like holidays and festivals such as Christmas and Ramadan. Or for example, when people go off to university or graduate, you'll find an increase in the sale of laptops. All these factors should be considered.
When clients are starting with the planning process, it’s good to run a brainstorming session. This could be a mind map, whiteboard, or post-it note session. There are many ways that you can do this, just make sure you’re getting as many different people's ideas as possible at this stage. If you look at the map below, you’ll see an example of this process for an ice cream company. As discussed previously, the company has listed all the factors they can control, such as availability, price, promotions, and advertising, followed by the factors out of their control, like seasonality, temperature, and competitors' activity.
Finally, you’ll want to put yourself in the shoes of your customers. Why might an individual purchase ice cream in the first place and why purchase your brand’s ice cream and not somebody else's? You’ll need to think much broader than the most obvious suggestions. For example, a small change to your brand’s website might have been a big deal internally, but as an outsider, your customers may not have even noticed. Or, it could be something bizarre, like roadwork on the main highway was preventing customers from getting to your store which heavily impacted sales or visits to a store in a specific area.
Conclusion
Now that we’ve covered some of the basic ideas around Marketing Mix Modeling, we hope you have a better understanding of how this technique can help you forecast and plan, allocate your budget, and make better-informed marketing decisions.
Or, if you have any questions or would like to discuss Marketing Mix Modeling further, please feel free to contact us by clicking the button below: