
.png?width=64&height=64&name=header%20product%20icons%20%20(9).png)
.png?width=64&height=64&name=header%20product%20icons%20%20(1).png)
.png?width=64&height=68&name=header%20product%20icons%20%20(2).png)
.png?width=64&height=64&name=header%20product%20icons%20%20(5).png)
.png?width=64&height=64&name=header%20product%20icons%20%20(4).png)
.png?width=64&height=64&name=header%20product%20icons%20%20(3).png)
.png?width=64&height=64&name=header%20product%20icons%20%20(11).png)
.png?width=64&height=64&name=header%20product%20icons%20%20(10).png)
.png?width=64&height=64&name=header%20product%20icons%20%20(6).png)
.png?width=64&height=64&name=header%20product%20icons%20%20(12).png)
.png?width=64&height=65&name=header%20product%20icons%20%20(28).png)
.png?width=64&height=64&name=header%20product%20icons%20%20(30).png)
.png?width=64&height=64&name=header%20product%20icons%20%20(13).png)
.png?width=64&height=64&name=header%20product%20icons%20%20(15).png)
.png?width=64&height=64&name=header%20product%20icons%20%20(14).png)
.png?width=156&height=156&name=header%20product%20icons%20%20(44).png)
.png?width=64&height=64&name=header%20product%20icons%20%20(16).png)
.png?width=64&height=64&name=header%20product%20icons%20%20(19).png)
.png?width=64&height=64&name=header%20product%20icons%20%20(17).png)
.png?width=64&height=64&name=header%20product%20icons%20%20(18).png)
.png?width=64&height=64&name=header%20product%20icons%20%20(20).png)
.png?width=64&height=64&name=header%20product%20icons%20%20(21).png)
.png?width=64&height=64&name=header%20product%20icons%20%20(24).png)
.png?width=64&height=64&name=header%20product%20icons%20%20(26).png)
.png?width=64&height=64&name=header%20product%20icons%20%20(23).png)
.png?width=64&height=64&name=header%20product%20icons%20%20(22).png)
.png?width=64&height=64&name=header%20product%20icons%20%20(25).png)
.png?width=64&height=64&name=header%20product%20icons%20%20(27).png)
 By
·
6 minute read
By
·
6 minute read
Collaboration story time
Let me tell you a short story and you can think about how closely it reflects what happens at your company. Maybe it is exactly what you experience; maybe just the initial set up is similar, but it plays out differently; maybe it’s a dream situation that never works out. Here we go:
.png)
Kate lives in New York and works as a manager in a big multinational company that faces a problem with a falling global market share. Kate wants to know more about what’s happening in each region and what might be done about it. She wakes up, and as it’s still within working hours in Europe, goes straight to her home office and calls John, the head of Marketing Intelligence for EMEA. She explains the situation and asks for some reports about what’s going on in his market. After the call, she finally gets her morning coffee and breakfast.

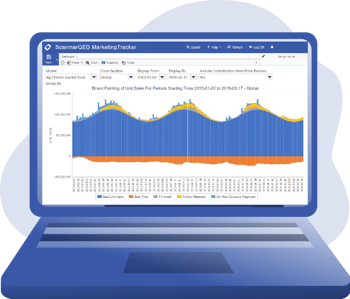
In the meantime, John, who is also working from his home in London, accesses the company intelligence system and clicks on Insights2Go. He navigates through the data and dashboards to find relevant information about what’s happening and what’s causing the drop in the market share. He Snapshots the relevant dashboards and creates an analytical Storyboard. To make sure nothing goes unnoticed, he types in additional context and conclusions in the Notes section. He then shares his Storyboard with Kate, within the secured remote working environment. As the Storyboard automatically updates whenever new data comes in, she will always have the newest insights available to her. By the time Kate finishes her breakfast, she has all the information from EMEA that she needs. As her whole New York team works from home, she hosts her morning session online. She opens the Storyboard in presenter mode and goes through it with her team.

What prevents successful digital collaboration
Watched the video? Click here to jump to the next part!
For many companies, making the right decision in a timely manner is difficult because. without seamless collaboration between the people who have to make the decisions and the people that are expected to provide the insights, this can be very challenging. Working remotely, during the current lockdown, highlights the shortcomings of some of the standard ways of virtual collaboration.,
Even in these times of rapid innovation most companies still rely on a combination of good old Excel, PowerPoint, and Email for collaboration tools. Unfortunately, this trio has many shortcomings when it comes to online collaboration, especially in the realm of data analytics.
Problems with Excel
20% of businesses use spreadsheets as the principle method of daily data communication (Forbes, 2016). The problem is that as much as they might be great for many things, visualizing and reporting your data is not one of them. You often have to choose between including all data, thus making it so big and complex that no one can actually read it, or simplifying it and losing valuable information. Either way, insights are lost which hinders your decision making.

Looking for information in Excel and analyzing it is just not user friendly. It’s hard to go through spreadsheet cells and make sure that nothing goes unnoticed. Just think about it, you don’t want to make an important business decision, just to find out that actually in a column FP row 2046 there was an important piece of data that got overlooked because of bad coloring. Sounds a bit silly until it really happens.
Problems with PowerPoint
Like it or not, presentations are still a prevailing tool for communication with over 30 million PowerPoint presentations being created every day (Speach, 2020) and although we often start using them (as early as in high school), most of us still “sigh” when tasked with preparing one. Even after years of experience it takes a lot of time to prepare a good presentation, especially if you want to convey a more complex message -- which is usually the case with analytics.

What often ends up happening is that running the analysis to answer a business question takes less time than preparing slides to present it. Do we want analytics teams to spend their time actually analyzing the data or becoming master designers? Unfortunately, time issues don’t end there. PowerPoint presentations don’t update automatically, so once you spent your precious time reporting on some crucial findings, the presentation will be out of date as soon as data changes. In the current fast-moving world, that is a big hindrance as it means a lot of manual work updating your presentation to make sure it reflects the current situation. Therefore, you risk making decisions based on outdated data which may lead to taking the wrong path for business.
Problems with Email
No matter how much we complain about the number of emails we get, they are not going away. Sure, there are many tools that try to reclaim the title of the king of business messaging, and many of them are doing a great job, but emails still prevail. Apart from the regular annoyance with receiving lots of emails, there are two issues that are specifically problematic when it comes to analytical collaboration.

First of all, it is quite likely that a report with some important insights gets lost in the massive stream of emails that everyone receives daily. Second of all, there is an issue of misinterpretation or acting on the wrong email. I think it’s a safe bet to assume that everyone at least once had a situation when they completely misunderstood the message in the email. It’s because we write emails quickly and try to read them even faster. What adds to that misunderstanding is that sometimes the latest email in a thread actually doesn’t contain the newest information as additional insights were sent using a different title. All of that results in poorer decision making, insights getting lost, and frustration within the team.
How to improve your collaborative analytics
Chances are that you can relate to at least some of these issues and by now you say to yourself “Sure, there are some problems, but it’s still the best option”. After using the traditional trio for years, it might feel like it’s as good as it gets. Fortunately, that’s not the case and you can have a more effective collaboration structure that allows you to get the most out of collaborative analytics.
.png?width=350&name=brainstorming_%20(1).png)
For the last couple of years, we’ve been working on developing and upgrading our collaboration features to make sure that your collaborative analytics teams don’t lose any effectiveness while working online. We wanted to make virtual collaboration as seamless and as effective as possible. To achieve this, we introduced Storyboards together with Notes and Storyline features to take your reporting to the next level. We also ensured that our sharing capabilities give you the needed flexibility and not rely solely on email or PowerPoint. So how does it work exactly?
Storyboard
Instead of exporting your data to Excel, analyzing it there, and then creating a presentation out of it, you can just select your dashboards and your Storyboard will be created automatically out of them. You don’t have to design your slides as dashboards are already a clear visualization of your data that paint an easy-to-understand picture. The best part is, as your dashboards update your Storyboard does as well, so you never have to spend time manually updating your reports and can be sure that they are always up to date for anyone who views them.
To make sure that no context is lost or to guide someone through the Storyboard when you can’t present it, you can add Storyline and Notes to point out key findings. Notes can also be used by other members of the team to comment on the dashboard; this way you can discuss and track your findings with others in an organized way and get the needed feedback from the team. The whole process is incredibly smooth and fast, saving you time while making sure that no actionable insights go unnoticed.
Now you don’t have to worry about someone getting lost in the giant Excel sheet, missing details, or looking at an outdated presentation in the PowerPoint!
Sharing
Creating a Storyboard to answer the business question in a comprehensive yet “easy to digest” way is just a first step; you then have to share it with the person who needs these insights or with the whole team. Luckily, neither you nor the person needing answers has to leave the software at any point. It can all be done in one place, ensuring that you have a single source of the truth where everyone uses the same file.

You can send your Storyboard straight to the user inbox of your co-workers (no email needed!) and they (or you) can open it in the presenter mode to host a presentation for anyone. That way, whenever you present your findings, you are always sure that these are the latest insights as the Storyboard will automatically update as the data changes. If you prefer, you can share it and present it in other ways as well. You can still send it using a good old email and export it as a PowerPoint presentation. Plenty of options for you to choose from.
Now you have one source of truth that is always up to date. You don’t have to worry about missed emails or people working on different copies.
Conclusion
The good old business trinity of Excel, PowerPoint, and Email is not going to be fully replaced any time soon, but there are some aspects in which other solutions prove to be more effective leading to better business performance. One of these aspects is the online collaboration of analytics’ teams and thanks to collaborative features embedded in our analytics software we are helping our clients to be as effective as possible no matter where they work from.
Making well-informed business decisions is crucial for a company’s performance and for that you need solid insights that are always at your disposal, always up to date, and presented in a clear fashion.

Sources
https://speach.me/7-reasons-you-should-stop-using-powerpoint/
https://www.time-management-success.com/advantages-and-disadvantages-of-email.html