
-2.png?width=200&height=200&name=Untitled%20design%20(40)-2.png)
-2.png?width=50&height=50&name=Untitled%20design%20(40)-2.png)


 By
·
3 minute read
By
·
3 minute read
New Features for Business Users
New Charts
The last few releases introduced several new charts to the collection. Why stop the trend? This time we welcome two new charts, the Map chart and the Correspondence Analysis chart.
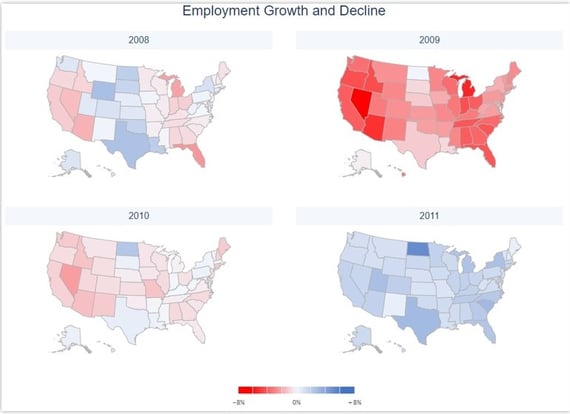
Map Chart
The Map chart lets you create maps from your geographical data to make it more visually attractive and easier to understand for the viewer. You can apply various formatting options such as color scales to indicate negative and positive values, adding labels to specific areas, and creating multiple panes for regional comparisons.
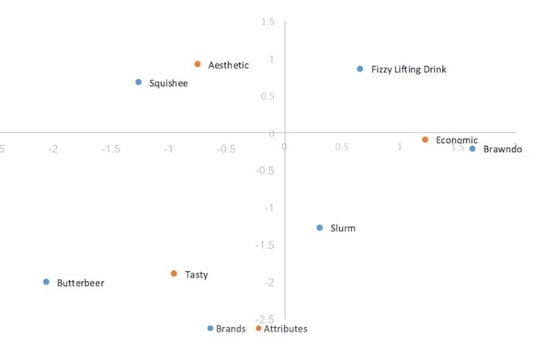
Correspondence Analysis Chart
Next up, we have the correspondence analysis chart that is particularly valuable for market research data. Correspondence analysis is a descriptive statistical technique that makes it easier to discover relationships between two or more categorical variables and spot patterns or trends. It takes tabulated data that can be complex to see relationships in and projects row and column variables into a more meaningful bi-plot chart - allowing for quicker interpretation of the data. Another tool in your hands to improve data analysis.
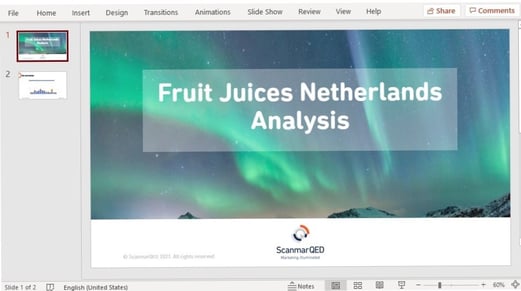
Presentation titles in PowerPoint
When exporting to PowerPoint, you can choose to create a title slide in the presentation. No need for you to create a cover slide in PowerPoint anymore. A seamless experience getting your presentation from MarketingTracker to your audience.
New Features for Dashboard Designers
Presentation titles in PowerPoint Set-up
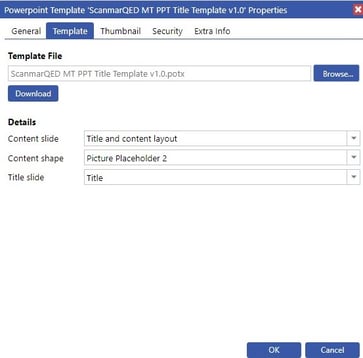
As a dashboard designer, you can enable the creation of a title slide by first making a template in PowerPoint that contains a title slide and a title placeholder in the Master View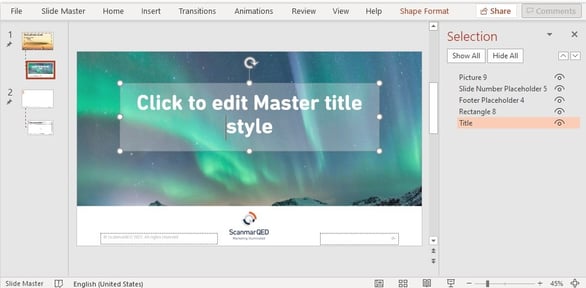 Then import the template into MarketingTracker and assign the title slide in PowerPoint to the corresponding field in the import dialogue.
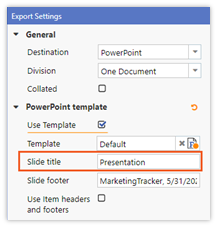
When a user exports a report, storyboard, or dashboard to PowerPoint, they can now select if they want to include a title slide. They simply check the ‘Presentation Title slide’ check box and enter a title, and it will be pulled through to PowerPoint. Less work for users and more on brand presentations in circulation!
Default Dashboard Titles
Additionally, in dashboard preferences, you can enter a default title so that when anyone downloads the dashboard, that title is used. For example, if you want the title style to match the company presentation style instead of the titles given in MarketingTracker. You can still change the title when exporting your dashboard to PowerPoint unless you use an export action. In that case, the title used will be the one you entered in the preferences.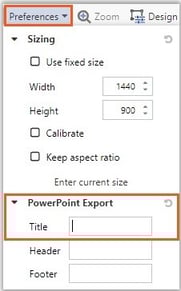 Lastly, MarketingTracker Presentation exports to PowerPoint can also include a title slide. You specify the title in the presentation export properties so that the full presentation export can be performed without user interaction.
Storyboard Pointer changes
Have you ever wanted to copy a storyboard and change the product or account it is referencing? Then you’ll be happy with the new ‘Change Pointers’ button and the accompanying wizard. It enables you to change the active pointer for all snapshots in the storyboard at once instead of individually. Saving you a huge amount of time!
The other scenario that this function is perfect for is if you want to change the data mart used for the storyboard to another data mart identical in structure. Let’s say the facts, statistics and periods match, yet the brand and accounts differ. The wizard identifies missing source pointers, and you can assign the new brand pointers.
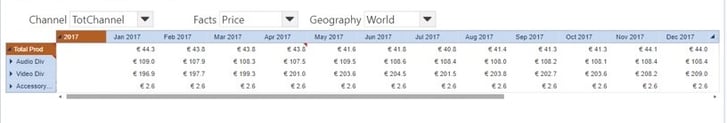 Before changing the pointers
 After changing the pointer
Smaller Improvements
New formatting option: Box Shadow
Elevate dashboard items placed in a freeform canvas by putting a shadow around them using the new box-shadow formatting option. You can find and configure this option in the format panel. New ways to make items stand out on the dashboard.

Improved type-ahead in multi-select pagers
If you open a multi-select pager and select either less than the minimum required items or more than the maximum allowed items, you can now re-access the type-ahead search field. A small change to improve your user experience.
Link to the e-Learning site
To help new MarketingTracker power users in your organization get up to scratch with the software or to refresh the knowledge of existing users, you can now add a link to the e-learning site in the help menu for them to access. As e-learning targets power users you can choose to enable it and show it to a particular group, like administrators.
Improved handling of the custom analytics formulas
Those of you who are more technically inclined may want to know that we have improved the formula handling of custom analytics in the backend. Now instead of creating multiple formulas for one ‘if-then-else construct, it is now put into one formula, which reduces nesting and gives more breathing space for complex database formulas.
New Features for Power Users
Deletion of data marts and dependent items and batch deletion of projects
Quickly clear out a batch of non-functioning data marts, projects, and related items and prevent users from seeing error messages when they open reports and dashboards. How? With the brand-new Data Mart and Project Cleaner functions in the Management area. These let you search for data marts and projects to delete and give you the option of deleting the items related to them, including the Oracle Analytical Workspaces. For peace of mind, you have the 'Simulate Delete' option to double-check you aren't deleting any vital items. A cleaner MarketingTracker site and fewer errors for users.
To activate this function, you will require an Advanced Delete license.
Want to Know More?
If you are not using MarketingTracker yet, but you are interested in learning more, you can read our product factsheet and request a demo here.
If you are already using MarketingTracker, you can log into the Knowledge Base to read the full release notes and find other educational content here.