
-2.png?width=200&height=200&name=Untitled%20design%20(40)-2.png)
-2.png?width=50&height=50&name=Untitled%20design%20(40)-2.png)


 By
·
1 minute read
By
·
1 minute read
Selected Plot line
As a dashboard designer, you can use the Selected plot line to give your viewers visual cues to help process the information in front of them. The Selected plot line is drawn against the active pointer or chosen value in the chart, Dallas, in our example below.
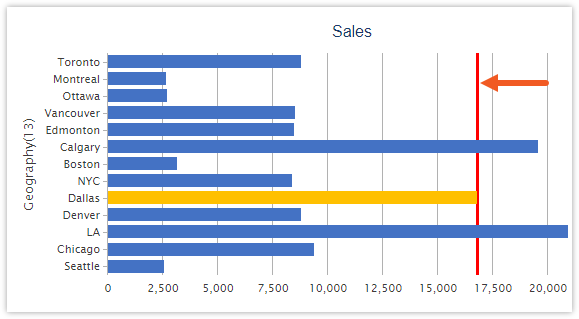
It can be used together with plot bands or other plot lines, like minimum and maximum, to make it easier to see where the chosen value lies compared to other values or areas in a chart.
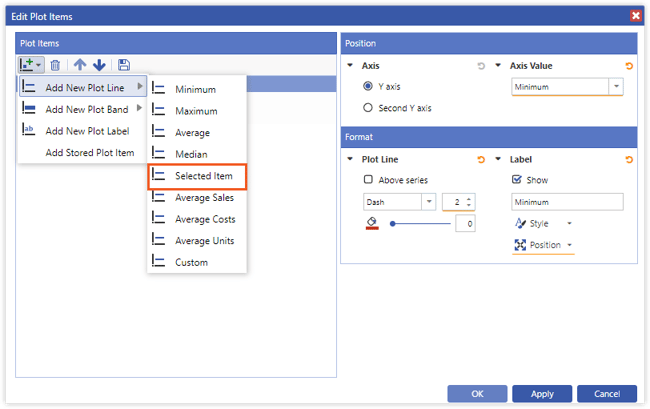
To draw a Selected plot line in your chart, go to the Plot Items dialog accessed from the Format tab. Select Add New Plot Line and Selected Item. Then fill in any formatting details and click OK. It will appear when you select a dimension value within your chart.
Pivots action
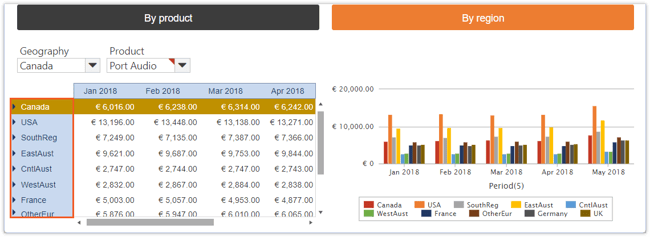
Get the insights you need at the click of a button with the new Pivots action. You can apply this action to a button, image, or textbox to change the point of view of your chosen tables or charts. For example, you can view sales by Product or Region in the following dashboard, depending on what you want to investigate. Just click on the corresponding button.
Sales by Product
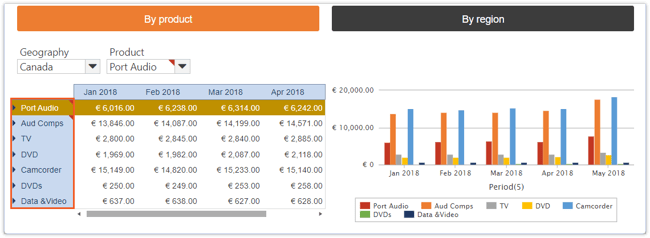
Sales by Region
Configure this in the Actions dialog by selecting (1) which button will trigger the action, (2) which report will have the action applied to it, then (3) arranging the dimensions in the pivot panel.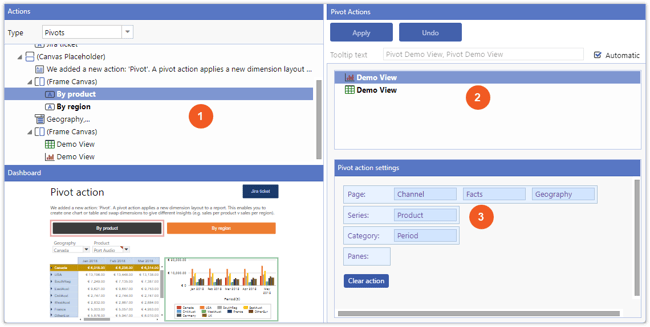
Want to know more?
If you are already using MarketingTracker, you can log into the Knowledge Base to read the full release notes and find other learning resources such as videos and quick reference documents.
If you are not using MarketingTracker yet, but you are interested in learning more, you can read our product factsheet and request a demo here.