
.png?width=64&height=64&name=header%20product%20icons%20%20(9).png)
.png?width=64&height=64&name=header%20product%20icons%20%20(1).png)
.png?width=64&height=68&name=header%20product%20icons%20%20(2).png)
.png?width=64&height=64&name=header%20product%20icons%20%20(5).png)
.png?width=64&height=64&name=header%20product%20icons%20%20(4).png)
.png?width=64&height=64&name=header%20product%20icons%20%20(3).png)
.png?width=64&height=64&name=header%20product%20icons%20%20(11).png)
.png?width=64&height=64&name=header%20product%20icons%20%20(10).png)
.png?width=64&height=64&name=header%20product%20icons%20%20(6).png)
.png?width=64&height=64&name=header%20product%20icons%20%20(12).png)
.png?width=64&height=65&name=header%20product%20icons%20%20(28).png)
.png?width=64&height=64&name=header%20product%20icons%20%20(30).png)
.png?width=64&height=64&name=header%20product%20icons%20%20(13).png)
.png?width=64&height=64&name=header%20product%20icons%20%20(15).png)
.png?width=64&height=64&name=header%20product%20icons%20%20(14).png)
.png?width=156&height=156&name=header%20product%20icons%20%20(44).png)
.png?width=64&height=64&name=header%20product%20icons%20%20(16).png)
.png?width=64&height=64&name=header%20product%20icons%20%20(19).png)
.png?width=64&height=64&name=header%20product%20icons%20%20(17).png)
.png?width=64&height=64&name=header%20product%20icons%20%20(18).png)
.png?width=64&height=64&name=header%20product%20icons%20%20(20).png)
.png?width=64&height=64&name=header%20product%20icons%20%20(21).png)
.png?width=64&height=64&name=header%20product%20icons%20%20(24).png)
.png?width=64&height=64&name=header%20product%20icons%20%20(26).png)
.png?width=64&height=64&name=header%20product%20icons%20%20(23).png)
.png?width=64&height=64&name=header%20product%20icons%20%20(22).png)
.png?width=64&height=64&name=header%20product%20icons%20%20(25).png)
.png?width=64&height=64&name=header%20product%20icons%20%20(27).png)
 By
·
1 minute read
By
·
1 minute read
To get these updates, simply open your software with Administrator rights, then go to the Help menu and select “Check for Updates” from the drop-down menu. Follow the update wizard screens. If you encounter any issues with updating your software, please contact us or access the Knowledge Base for further help.

Usability
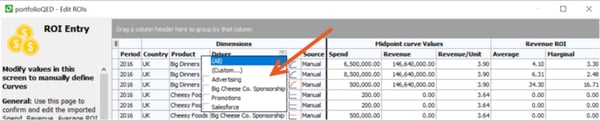
Long awaited, custom grids!
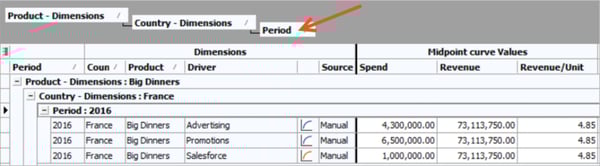
You can now sort, filter, group and even customize the hierarchical view on several key grids, such as the Curves, Values and Performance screens.
While the default approach is typically to load model results from strataQED, the reality of business planning means that nearly every project must include some level of customization. The new advanced grids allow for sorting, filtering, grouping and restructuring individual grids within the complex hierarchical structures of portfolioQED. Once you have updated your software, check out the “Sorting, filtering and grouping in grids” help topic within the portfolioQED Help file for full details of this functionality or watch our demo video by clicking the following link:
https://www.scanmarqed.com/res...
This makes it significantly faster, easier, and more accurate, to review model import data and to manually enter key inputs (when manual entry is required)
Scenario Management
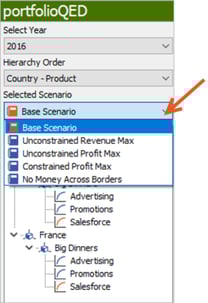
The new Selected Scenario function means that you will no longer have to scroll through long lists of scenarios. The scenario level viewer will now display only one scenario at a time, and a drop-down menu allows you to select the scenario you wish to view, and best of all, the hierarchy expansion selections hold from screen to screen as the selected scenario is changed.
New Metrics
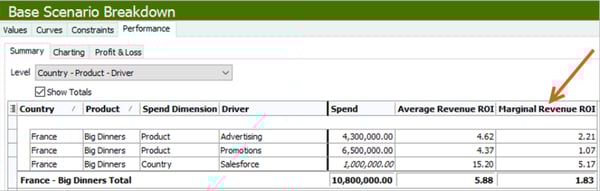
Marginal ROI Reporting
While Marginal ROI has always been a critical part of portfolioQED, it was originally kept in the background to simplify the view. Through user feedback we realized that rather than simplify (this made it harder to understand the results of optimizations) we now report Marginal ROIs for all scenarios as well as the change in Marginal ROI. The ability to see where all marginals are in an optimized budget helps you understand why the optimal is the optimal.
Want to know more?
The entire list of changes and improvements is available in the release notes as well as in the “What’s New?” topic in portfolioQED help file.