
.png?width=64&height=64&name=header%20product%20icons%20%20(9).png)
.png?width=64&height=64&name=header%20product%20icons%20%20(1).png)
.png?width=64&height=68&name=header%20product%20icons%20%20(2).png)
.png?width=64&height=64&name=header%20product%20icons%20%20(5).png)
.png?width=64&height=64&name=header%20product%20icons%20%20(4).png)
.png?width=64&height=64&name=header%20product%20icons%20%20(3).png)
.png?width=64&height=64&name=header%20product%20icons%20%20(11).png)
.png?width=64&height=64&name=header%20product%20icons%20%20(10).png)
.png?width=64&height=64&name=header%20product%20icons%20%20(6).png)
.png?width=64&height=64&name=header%20product%20icons%20%20(12).png)
.png?width=64&height=65&name=header%20product%20icons%20%20(28).png)
.png?width=64&height=64&name=header%20product%20icons%20%20(30).png)
.png?width=64&height=64&name=header%20product%20icons%20%20(13).png)
.png?width=64&height=64&name=header%20product%20icons%20%20(15).png)
.png?width=64&height=64&name=header%20product%20icons%20%20(14).png)
.png?width=156&height=156&name=header%20product%20icons%20%20(44).png)
.png?width=64&height=64&name=header%20product%20icons%20%20(16).png)
.png?width=64&height=64&name=header%20product%20icons%20%20(19).png)
.png?width=64&height=64&name=header%20product%20icons%20%20(17).png)
.png?width=64&height=64&name=header%20product%20icons%20%20(18).png)
.png?width=64&height=64&name=header%20product%20icons%20%20(20).png)
.png?width=64&height=64&name=header%20product%20icons%20%20(21).png)
.png?width=64&height=64&name=header%20product%20icons%20%20(24).png)
.png?width=64&height=64&name=header%20product%20icons%20%20(26).png)
.png?width=64&height=64&name=header%20product%20icons%20%20(23).png)
.png?width=64&height=64&name=header%20product%20icons%20%20(22).png)
.png?width=64&height=64&name=header%20product%20icons%20%20(25).png)
.png?width=64&height=64&name=header%20product%20icons%20%20(27).png)
 By
·
4 minute read
By
·
4 minute read
What are response curves and why you should care about them
Response curves are one of the most important outputs that Marketing Mix Modeling gives us. They map the inputs of a system to its outputs and are vital to determining the optimal allocation of resources across various marketing activities.
Let’s for a moment imagine a scenario where an individual, we’ll call her Meena, finds herself living as a castaway on a desert island - preindustrial era. Amidst her isolation, she discovers a peculiar alien device that responds to different levels of force. Intrigued by this, Meena conducts experiments by varying the intensity of her actions and observing the device's various responses.
-2.png?width=729&height=410&name=BLOGS%20(10)-2.png)
In our marketing context, Meena represents the marketing manager seeking to justify budget allocations for advertising initiatives; the alien device's reactions parallel the revenue generated in response to varying marketing expenditures. Through systematic experimentation, Meena creates visual representations of these interactions, akin to sketches on a cliff face.
In the realm of marketing, Meena’s sketches transform into response curves, illustrating the relationship between marketing spending and resulting revenue. Just as Meena adjusts her experiments to understand the alien device better, marketers utilize response curves to optimize their strategies.
Meena’s charcoal scratched on a cliff face is the forecasting tool; each curve she draws encapsulates a specific marketing tactic's impact on revenue, providing actionable insights for decision-making. For instance, a curve exhibiting diminishing returns suggests the need for diversification across multiple channels to maintain effectiveness. That’s why response curves are the key output of a marketing mix model. The response function lets us (or Meena) answer the question: “what if we did more marketing?”
Now, empowered by her newly created curves, Meena the marketing manager is able to allocate her budget resources strategically to maximize marketing’s return on investment.
Let’s see where Meena’s insights take her; she could go to her budgeting meetings with a single curve – the response function mapping business outcomes to total marketing expenditure. But she realizes that in order to explain how that total budget is best shared between the different tactics, she will need response curves for each line in her budget.
And now this is where Meena might get a bit stuck. It is conceptually easy to vary a total budget up a bit at a time and record the business’ outcomes; it’s not so straightforward to vary TV, Branded and Unbranded Search, Meta and Snap, Billboard, etc. and understand how much of each business outcome is linked to those changes. Marketing mix models solve this for us by using the variation in historical marketing levels to separate the effect on a business of different marketing channels. Once those effects are measured, it is possible to extract a response curve from the model by making predictions with the model for different marketing activity levels of interest.
.png?width=723&height=188&name=And%20now%20this%20is%20where%20Meena%20might%20get%20a%20bit%20stuck.%20It%20is%20conceptually%20easy%20to%20vary%20a%20total%20budget%20up%20a%20bit%20at%20a%20time%20and%20record%20the%20business%E2%80%99%20outcomes%3B%20it%E2%80%99s%20not%20so%20straightforward%20to%20vary%20TV%2c%20Bran%20(1).png)
Example Response Curves
The chart below shows some hypothetical response curves. The vertical axis can represent revenue due to each marketing tactic for a given week, with the x axis representing the amount of that tactic occurring in the week. 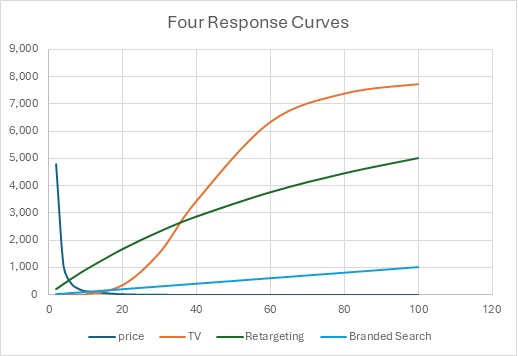
From this view, Meena can see immediately that she has a curve that drives revenue down – but that it is price, which makes sense. And she can also see that, at some levels of spend, each of her three marketing tactics generates more revenue per unit of spend than the other. Meena (and hopefully all of us) can see a bit more by considering each curve on its own, in turn.
Price: negative, constant elasticity
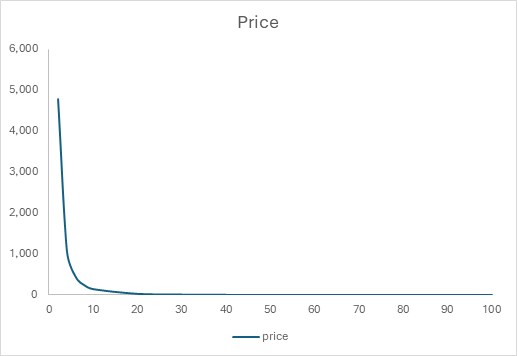
This curve screams that increasing the x axis is going to bring down revenue very rapidly! This is representative of a product with highly elastic demand, and of course Meena wouldn’t want to suggest a price increase if her goal was to drive revenue up. Marketing managers may not get a lot of input into prices, but it is common for marketing mix models to include price effects so that the impact of price movements aren’t attributed to marketing. In Meena’s case, she might also use this response curve in the next business review meeting to explain why revenue fell short of target, even with her well planned and executed marketing budget!
Branded Search: linear response
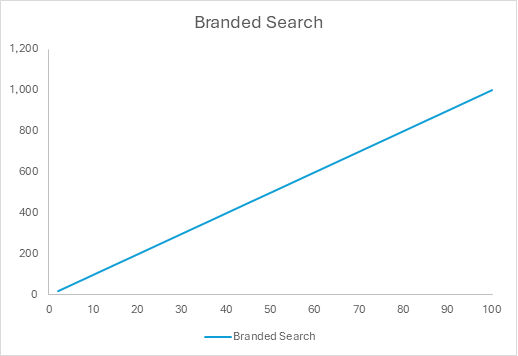
This chart gets us back to a positive state of mind. Here we see that increasing branded search will lead to increases in revenue. In contrast to other marketing curves, it appears that the more we spend the more we get – forever upward! This is unlikely to be true, of course.
One reason a MMM might fail to detect curvature in a response is if the budget is well below saturation (which is evidence that the budget can be dramatically increased). Unfortunately, sometimes the vagaries of real-world data make saturation difficult to detect, and this can also be an indication that the model is pulling revenue from other causes into the response curves. In general, this kind of linear response shouldn’t be assumed to be correct and Meena would be wise to be cautious with planning spend well above historical values; she should instead inch her budgets up a bit at a time to verify this curve’s forecasts.
Retargeting: positive, concave curve
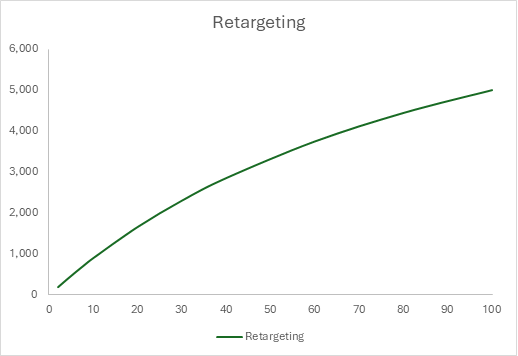
This curve might be considered the most typical MMM response curve of the bunch. It shows an increase in revenue will come with an increase in retargeting expenditure, but that for each increment of spend the resulting increment in revenue will be less than the previous increment in expenditure generated. This is known as ‘diminishing marginal returns’ and one argument for an omni-channel marketing plan is that marketers should expect returns to diminish as they saturate the audience reachable in any given channel. Meena will not be surprised by this curve. She still shouldn’t trust extrapolations far outside of historical data, but she might allow any optimizations to explore farther away from historical values. Additionally, this curve shape implies that an ‘always on’ budget, even at low levels, will be very cost-efficient.
TV: positive, s-shaped curve
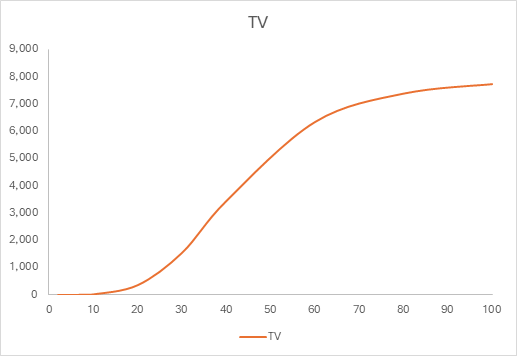
The S-curve we have here is very satisfying for analytics teams and for marketers. It indicates that there is a breakthrough spend amount (i.e. a point after which efficiency increases, around 20 on the x-axis) and then a point after which marginal diminishing returns exist (around 60 on the x-axis). This implies that there is a ‘sweet spot’ -- a level where the efficiency is maximized (around 50 on the x-axis). When keeping a channel on at this level is too expensive to do every week, the next best option is to set as many weeks to zero as needed to have the remaining weeks operate near the sweet spot. Meena is a savvy marketer, however, so she knows that profit maximization is not the same as efficiency maximization if her budget total is varying, and so instead of eyeballing the right weekly level of spend for TV, she will use an optimization tool to consider all of her response curves (and her budget constraints) to ultimately determine her TV spend and flighting pattern.
Meena the marketing manager is in good shape – her mix vendor has given her reasonable curves for 3 of her 4 drivers and she has the knowledge to keep that fourth linear response from causing her planning process any problems.
But what about Meena, our castaway?
As for Meena's island escapades, her experiments with the alien device attract unexpected attention but ultimately lead to newfound opportunities, echoing the transformative power of data-driven insights in both marketing and unexpected situations.