
.png?width=64&height=64&name=header%20product%20icons%20%20(9).png)
.png?width=64&height=64&name=header%20product%20icons%20%20(1).png)
.png?width=64&height=68&name=header%20product%20icons%20%20(2).png)
.png?width=64&height=64&name=header%20product%20icons%20%20(5).png)
.png?width=64&height=64&name=header%20product%20icons%20%20(4).png)
.png?width=64&height=64&name=header%20product%20icons%20%20(3).png)
.png?width=64&height=64&name=header%20product%20icons%20%20(11).png)
.png?width=64&height=64&name=header%20product%20icons%20%20(10).png)
.png?width=64&height=64&name=header%20product%20icons%20%20(6).png)
.png?width=64&height=64&name=header%20product%20icons%20%20(12).png)
.png?width=64&height=65&name=header%20product%20icons%20%20(28).png)
.png?width=64&height=64&name=header%20product%20icons%20%20(30).png)
.png?width=64&height=64&name=header%20product%20icons%20%20(13).png)
.png?width=64&height=64&name=header%20product%20icons%20%20(15).png)
.png?width=64&height=64&name=header%20product%20icons%20%20(14).png)
.png?width=156&height=156&name=header%20product%20icons%20%20(44).png)
.png?width=64&height=64&name=header%20product%20icons%20%20(16).png)
.png?width=64&height=64&name=header%20product%20icons%20%20(19).png)
.png?width=64&height=64&name=header%20product%20icons%20%20(17).png)
.png?width=64&height=64&name=header%20product%20icons%20%20(18).png)
.png?width=64&height=64&name=header%20product%20icons%20%20(20).png)
.png?width=64&height=64&name=header%20product%20icons%20%20(21).png)
.png?width=64&height=64&name=header%20product%20icons%20%20(24).png)
.png?width=64&height=64&name=header%20product%20icons%20%20(26).png)
.png?width=64&height=64&name=header%20product%20icons%20%20(23).png)
.png?width=64&height=64&name=header%20product%20icons%20%20(22).png)
.png?width=64&height=64&name=header%20product%20icons%20%20(25).png)
.png?width=64&height=64&name=header%20product%20icons%20%20(27).png)
 By
·
1 minute read
By
·
1 minute read
Model Definition can now sort, filter, and search
First new feature is something that has been requested by many, the ability to filter, search, and sort within the Model Definition grid. Working with large datasets has never been easier!

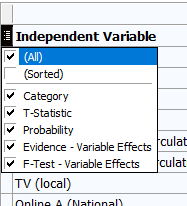
As your dataset grows it might become hard to find a specific variable. Luckily, now you can make it much easier for yourself by applying filters. Best news is that you can also create custom ones, so no matter what your situation is, you will quickly find what you are looking for.
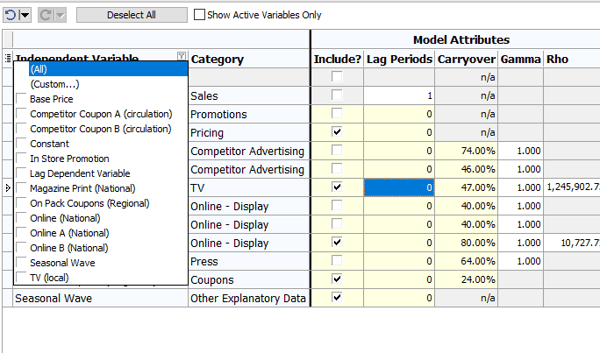
One thing that can help you to quickly decide which variable to add to your model is sorting on T-Statistic or Probability value. Improving your model has never been quicker and easier!
Are you working on a smaller screen or just want to focus on something in specific? No problem! Now you can hide columns that you are not interested in to reduce the size of the table.
Not using strataQED yet? You can find out more about it and request a demo here.
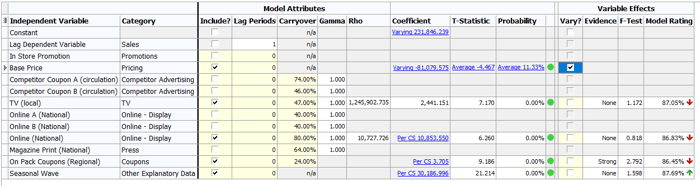
More information for time-series cross-sectional models
Where we previously displayed “Per Cross Section” or “Varying” in the coefficient column you can now see the global coefficient. Similarly, for variables with varying effects between cross-sections, you can view the average t-statistic and probability. Clicking on these figures will take you to the Variable Statistics tab where you can see all the cross-sectional details as before.
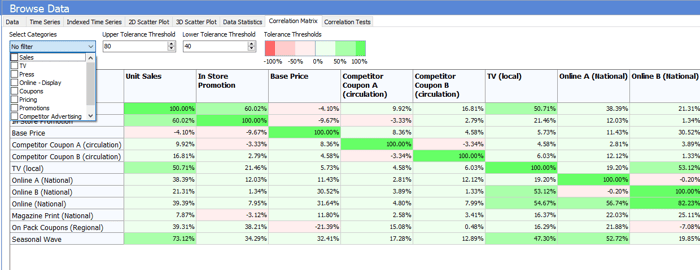
Even more filters
Another improvement for those with large files. On the Correlation Matrix, you can filter by category, making it quicker and easier to analyze your data.
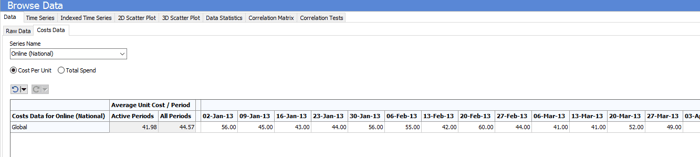
Costs Data
Tracking the costs of each activity is a very important part of your marketing effectiveness. Without it, it’s hard to judge success. Now strataQED provides you even more information on it! You can see the average cost per unit over the entire timeframe and the active periods only, giving you a more accurate reflection of the cost of each activity.
Are you interested in learning more?
If you are not using strataQED yet, you can learn more about it and request a demo here.
If you are already a strataQED user, you can find out more in the "What’s New” file that opens up when you download the update, as well as in the "What’s New" topic in the Help file.