.png?width=64&height=64&name=header%20product%20icons%20%20(9).png)
.png?width=64&height=64&name=header%20product%20icons%20%20(1).png)
.png?width=64&height=68&name=header%20product%20icons%20%20(2).png)
.png?width=64&height=64&name=header%20product%20icons%20%20(5).png)
.png?width=64&height=64&name=header%20product%20icons%20%20(4).png)
.png?width=64&height=64&name=header%20product%20icons%20%20(3).png)
.png?width=64&height=64&name=header%20product%20icons%20%20(11).png)
.png?width=64&height=64&name=header%20product%20icons%20%20(10).png)
.png?width=64&height=64&name=header%20product%20icons%20%20(6).png)
.png?width=64&height=64&name=header%20product%20icons%20%20(12).png)
.png?width=64&height=65&name=header%20product%20icons%20%20(28).png)
.png?width=64&height=64&name=header%20product%20icons%20%20(30).png)
.png?width=64&height=64&name=header%20product%20icons%20%20(13).png)
.png?width=64&height=64&name=header%20product%20icons%20%20(15).png)
.png?width=64&height=64&name=header%20product%20icons%20%20(14).png)
.png?width=156&height=156&name=header%20product%20icons%20%20(44).png)
.png?width=64&height=64&name=header%20product%20icons%20%20(16).png)
.png?width=64&height=64&name=header%20product%20icons%20%20(19).png)
.png?width=64&height=64&name=header%20product%20icons%20%20(17).png)
.png?width=64&height=64&name=header%20product%20icons%20%20(18).png)
.png?width=64&height=64&name=header%20product%20icons%20%20(20).png)
.png?width=64&height=64&name=header%20product%20icons%20%20(21).png)
.png?width=64&height=64&name=header%20product%20icons%20%20(24).png)
.png?width=64&height=64&name=header%20product%20icons%20%20(26).png)
.png?width=64&height=64&name=header%20product%20icons%20%20(23).png)
.png?width=64&height=64&name=header%20product%20icons%20%20(22).png)
.png?width=64&height=64&name=header%20product%20icons%20%20(25).png)
.png?width=64&height=64&name=header%20product%20icons%20%20(27).png)
 By
·
2 minute read
By
·
2 minute read
Key features allow you to:
- View the direct and indirect effects of your marketing spend
- Optimize against volume, revenue or profit
- Target key periods to maximize returns
Alongside these key features come several other enhancements, like clearer reporting for nested models, improvements to the optimization interface and the ability to customize traffic light colors to support users with color vision deficiency.
Time Series:
With strataQED’s Time Series screen we’ve always been able to plot the plan data which enables you to see what the level of sales (or other dependent KPI) would be with our current plan. Now with Nested Forecasting, we can plot our dependent KPI (sales in this case) against one of our intervening series, such as online engagement, and display a forecast line for that too.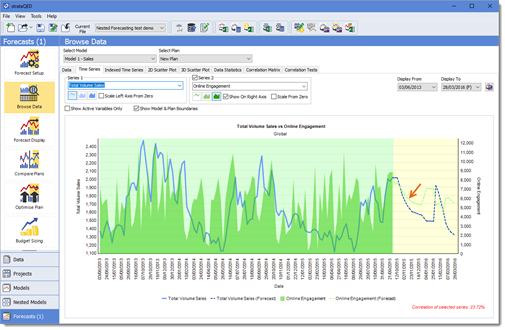
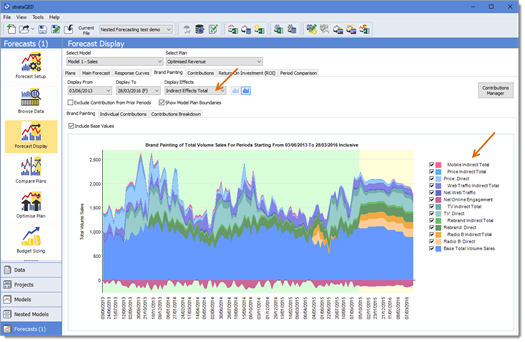
Brand Painting:
The Nested Forecasting reporting tabs display as per standard modeling, except that instead of the “Group By” option we now have the “Display Effects” field, which allows you to view the direct and indirect effects for selected drivers. For example, if we go to Forecast Display and select the Brand Painting tab, we can see the Direct Effects as per standard modeling or the Indirect Effects by Model (or Total) as shown here. Likewise, the Return On Investment tab shows you how the contribution and ROI for a given activity are increased when you include the indirect effects in your plan.
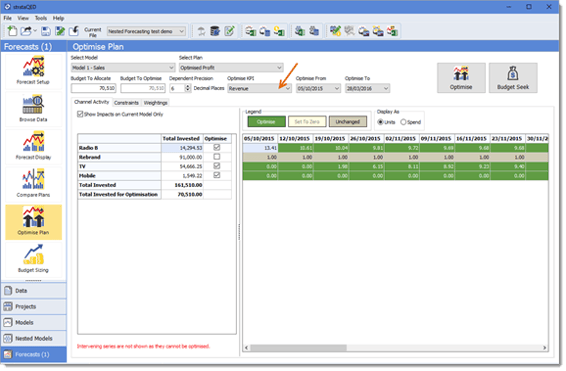
 Optimise Plan:
The Optimise Plan screen works in the same way as for standard optimization, with a couple of new features. You can now view the total that is being invested for all individual series and as you select a series to include in an optimization the “total invested for optimisation” updates to reflect the drivers you select. Double-click in that cell to populate the Budget to Allocate field.
If you decide to set some periods unchanged for a driver that is to be optimized, then the Budget to Optimise box will auto-update to take account of this.
Each company has a different financial objective, so now when optimizing you can select the appropriate KPI you wish to optimize, be that volume, revenue or profit. If your value contribution per dependent unit or profit margin varies over time, this will help you target the key periods to maximize your returns.
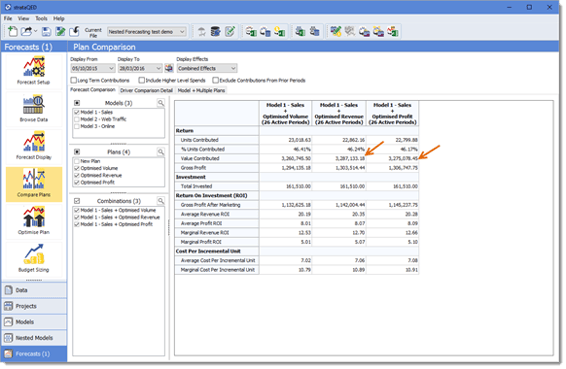
 Compare Plans:
If, for example, you select to optimize revenue, after running your optimization you can compare the forecasted amount of revenue against what would have been achieved had you optimized against volume or profit instead. You’ll see that where you optimized revenue, this plan has created the greatest amount of revenue, likewise for profit.
 strataQED’s Nested Forecasting and Optimization performs the reattribution automatically, providing you with more accurate and timely sales forecast predictions – allowing you to spend more time making important budget allocation decisions, instead of gathering and preparing data.
This short video below provides an overview of how our new Forecasting and Optimization software can help your organization gain new insights into the way customers interact with brands today.

Want to know more?
If you are interested to learn more about how strataQED's Nested Forecasting & Optimization module can help you effectively plan your campaign, you can request a demo by clicking the button below.