
.png?width=64&height=64&name=header%20product%20icons%20%20(9).png)
.png?width=64&height=64&name=header%20product%20icons%20%20(1).png)
.png?width=64&height=68&name=header%20product%20icons%20%20(2).png)
.png?width=64&height=64&name=header%20product%20icons%20%20(5).png)
.png?width=64&height=64&name=header%20product%20icons%20%20(4).png)
.png?width=64&height=64&name=header%20product%20icons%20%20(3).png)
.png?width=64&height=64&name=header%20product%20icons%20%20(11).png)
.png?width=64&height=64&name=header%20product%20icons%20%20(10).png)
.png?width=64&height=64&name=header%20product%20icons%20%20(6).png)
.png?width=64&height=64&name=header%20product%20icons%20%20(12).png)
.png?width=64&height=65&name=header%20product%20icons%20%20(28).png)
.png?width=64&height=64&name=header%20product%20icons%20%20(30).png)
.png?width=64&height=64&name=header%20product%20icons%20%20(13).png)
.png?width=64&height=64&name=header%20product%20icons%20%20(15).png)
.png?width=64&height=64&name=header%20product%20icons%20%20(14).png)
.png?width=156&height=156&name=header%20product%20icons%20%20(44).png)
.png?width=64&height=64&name=header%20product%20icons%20%20(16).png)
.png?width=64&height=64&name=header%20product%20icons%20%20(19).png)
.png?width=64&height=64&name=header%20product%20icons%20%20(17).png)
.png?width=64&height=64&name=header%20product%20icons%20%20(18).png)
.png?width=64&height=64&name=header%20product%20icons%20%20(20).png)
.png?width=64&height=64&name=header%20product%20icons%20%20(21).png)
.png?width=64&height=64&name=header%20product%20icons%20%20(24).png)
.png?width=64&height=64&name=header%20product%20icons%20%20(26).png)
.png?width=64&height=64&name=header%20product%20icons%20%20(23).png)
.png?width=64&height=64&name=header%20product%20icons%20%20(22).png)
.png?width=64&height=64&name=header%20product%20icons%20%20(25).png)
.png?width=64&height=64&name=header%20product%20icons%20%20(27).png)
 By
·
3 minute read
By
·
3 minute read
The available data sources and their challenges
As the world tries to grasp the Covid-19 crisis, the rapid, unprecedented speed of the virus’ spread is making it difficult for individual businesses to assess their mid to long term business implications. As companies turn to analytics to control for the uncertainty of an economic shock, it is often difficult to navigate the available data sources.

In normal times, to forecast and plan for these unknown, external factors, we will often use macroeconomic factors to control for effects outside of a business’s control. Where we traditionally use broad governmental data to measure the macroeconomy (GDP, unemployment rate, etc.), these metrics are aggregated and reported via a relatively slow cadence, something inadequate for real-time measurement of the broader economy that the virus now demands.

While we caution against using these macroeconomic data sources, this does not mean all governmental data is without merit for the expediency we require. One of the more granular sources available today is initial unemployment claims. These figures are released on a weekly basis, meaning they are more informative in real time than the unemployment rate or GDP (monthly).
Under normal circumstances, weekly data is sufficient for measuring shifts in the macroeconomy as it provides national/state level data quickly, while providing aggregation to smooth most daily, one-off shocks. However, the reporting of initial claims data is lagged by a week and should be read with caution when considering Covid-19’s effects on current forecasting.

For instance, on March 26, the Federal Reserve released the first week of national unemployment claims since the crisis began, with data for the week ending March 211.Yet, on this same day, US financial markets all went up. Why? Because the lagged data had already been expected and processed by financial markets2.
While it is unlikely your business will require data at this same speed, by the time the unemployment data was available, alternative sources had already been used and processed by financial markets to quantify the current labor shock.
As you are trying to reassess sales forecasts in real-time, you cannot afford to wait on this data to estimate the virus’s effect on your company. What then are the options for understanding the economic impact in real-time?
Example of a potential data source

Fortunately, our modern economy continues to create new data sources with the potential to provide rich information that is useful in planning and forecasting- we just need to know where to find it and how to interpret it. One possibility is using data from OpenTable, the online restaurant reservation service. The company has publicly released year-over-year daily reservation figures at the national, state, and city level3. With this data, you can control for Covid-19’s impact on your business by using it as a proxy for economic measurements of the virus, days or even weeks more the traditional data sources are available.
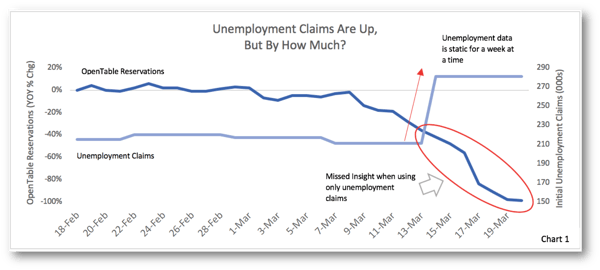
Comparing the two series visually after the first week of nationwide infections (Chart 1), unemployment claims were up. However, the data was still missing many of these claims, as evidenced by the YOY reservation decreases in the lagged data (circled). Under a proactive forecasting approach, your business could use OpenTable data to estimate the effect of large unemployment before the traditional data were available, similar to the financial markets4. By using OpenTable’s data as the control for these weeks, you immediately give your forecast actual figures to explain otherwise large uncertainties and can begin reliably forecasting for the effect weeks before the most accurate government data is available.
We must be creative in our data sources while waiting on official datasets. Finding abstract sources, like that from OpenTable, will allow your company to control for the Covid-19 economic shock, and create a more accurate forecast for drastic changes in the economy.
ScanmarQED's Marketing Mix Modeling (MMM) as a solution
At ScanmarQED, we use diverse datasets incorporated into Marketing Mix Modeling (MMM) to answer client’s tough marketing questions by measuring their effectiveness and efficiency. With evolving data sources, we can assist in providing the suitable alternatives for more traditional data and incorporate these unique macroeconomic factors within the MMM. It is our mission to provide clients with total support in this uncertain economic landscape and help clients forecast for the future and plan for the unexpected.
[1] https://fred.stlouisfed.org/series/ICSA
[2] https://www.cnbc.com/2020/03/26/markets-take-3-million-claims-in-stride-and-now-brace-for-tsunami-of-negative-news.html
[3] https://www.opentable.com/state-of-industry
[4] A word of caution: with the ever-evolving economic situation, data sources that may be useful now may not prescribe the same explanatory value in the future. It is important to keep evaluating these nonstandard sources.