In this new version, we’ve added several features to improve collaboration in order to help standardize the ways of working within your organization in terms of reporting data and data analysis. We’ve also extended connectivity options in order for you to link to your existing tool set, as well as making adjustments that result in better usability.
Let’s explore these features in more detail!
New features for Business Users
#1 Storyboard Enhancements
Storyboards have been enhanced for better collaboration while working on your analyses so that you can easily co-create and share valuable findings.
Storyboards can now be published from your personal items to a publication or project. This allows you to build your storyboard, create reports for example, privately in your personal explorer and share it when it’s ready.
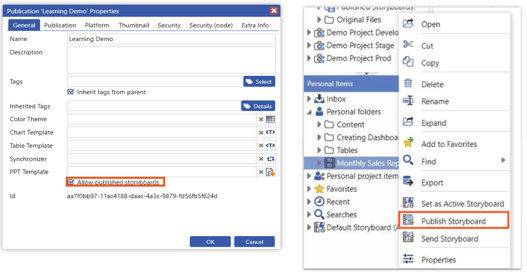
Prior to publishing a storyboard and making it public, you can send it for review to a selection of users or user groups using the new “Send Storyboard” option.
![]()
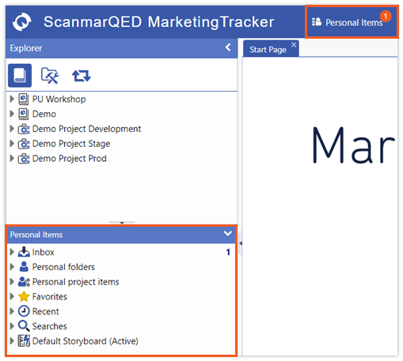
Additionally, every user now has access to a Personal Items area! The appearance of Personal Items has been updated to include the new storyboard inbox, and now also contains the Favorites, Recent, Searches, and the Default Storyboard items, that were previously in the Publications area of the Explorer.
#2 Chart Improvements
More charting options are now available at your fingertips! Introducing the new Dependency Wheel Chart – a type of flow chart that enables you to visualize dependencies or relationships between items. This flow chart, for instance, can be used to present a “To” and “From” relationship as the country import and export shown in the image below:
.png?width=403&name=Dependency%20Wheel%20(2).png)
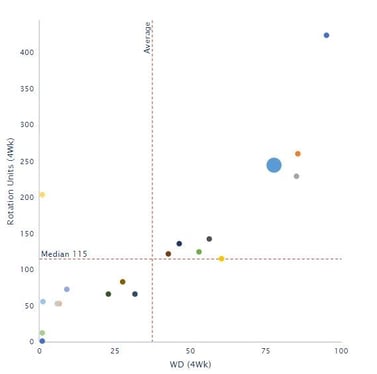
We’ve also implemented default plot lines and plot bands so you can quickly apply them into your chart data. New ways to easily highlight the area that you want viewers to focus on!
New features for Dashboard Designers
#1: Create a personal storyboard from within a dashboard
What about users that do not have access to the Explorer area and use a Dashboard Explorer to navigate to various reports and dashboards? How do they access the new storyboard features?
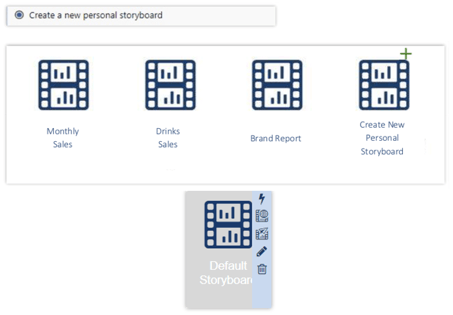
Don't worry. As a dashboard designer, you can create a button within your dashboards that can be assigned to creating and activating a new personal storyboard.
You can then enable a toolbar for dashboard items. For storyboards this will show the "Send Storyboard" and "Publish Storyboard" options.
#2: Availability of standard chart templates and icons
To speed up the creation of reports and dashboards, we have incorporated a few ScanmarQED standardized templates for dashboard/report designers to use. We have created these templates for tables, charts, dashboards, as well as incorporated our own icon library. The icon colors can be customized as part of a color theme, saving you time preparing icons outside of the tool or creating multiple icons in different colors. You can also re-use the icons in different projects and color these based on the clients corporate colors.
New features for Super Users
#1: Management of new storyboard features
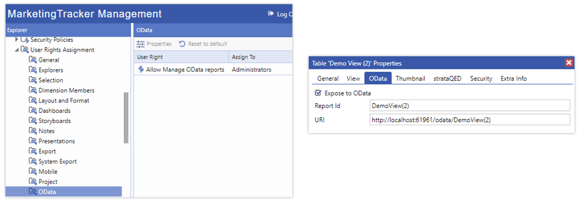
With MarketingTracker 5.17, you can now give users permission to access the inbox, send storyboards, and published storyboards features in the user rights section of the management area. This will give you lots of options to customize this new feature according to your organization’s needs.
#2: OData Support
MarketingTracker is now an OData compatible, meaning you can simply share the latest report data to applications that consume OData, such as Excel. This gives you more versatility in processing insights. A seamless connection to all your in-house and client’s tools so that your data never varies.
#3: strataQED Connectivity
When two powerful pieces of software come together, the possibilities are endless. MarketingTracker now has two-way connection with our forecasting software strataQED. This means that any marketing mix models created in strataQED can be imported to MarketingTracker, adjusted, formatted, incorporated into your reports, and most importantly, easily shared with your organization. More power in your hands to get the information you need from your data so that you can take your business to the next level!
Would you like to know more?
Click on the button below to find full release notes, the highlights video, and more for this update or contact one of our consultants directly:

Or contact us to find out more about MarketingTracker:

.png)